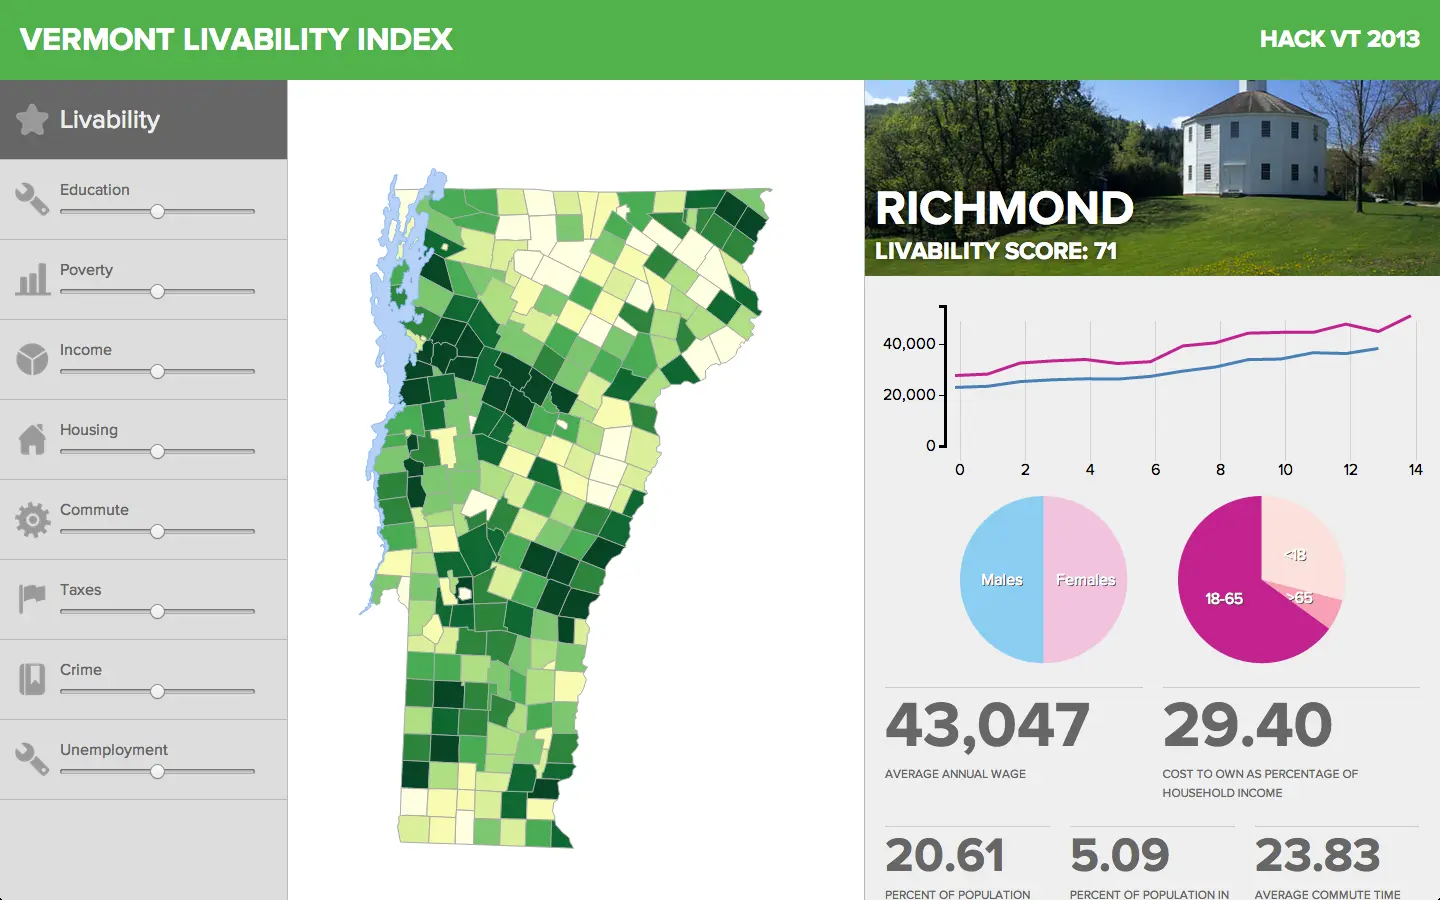
Vermont Livability Index
The Vermont Livability Index is a project started during the HackVT hackathon, held at MyWebGrocer in Winooski, VT on October 12, 2013.
The project intends to determine the “livability” of Vermont towns based on a variety of criteria. Each of the criteria is backed by data from the Vermont Center for Rural Studies and Vermont Housing Data. Users can also weight the criteria based on their personal preferences and concerns, in order to calculate a personal livability index and identify their ideal towns.
I enjoyed working on this project along with team members Brian Holdefehr and Matt Parrilla. Although we did not win any awards, the project was a success in that we completed development of a working web app over the course of 24 hours. It also provided an opportunity to familiarize myself with the JavaScript visualization library d3.js and the Python Imaging Library.